
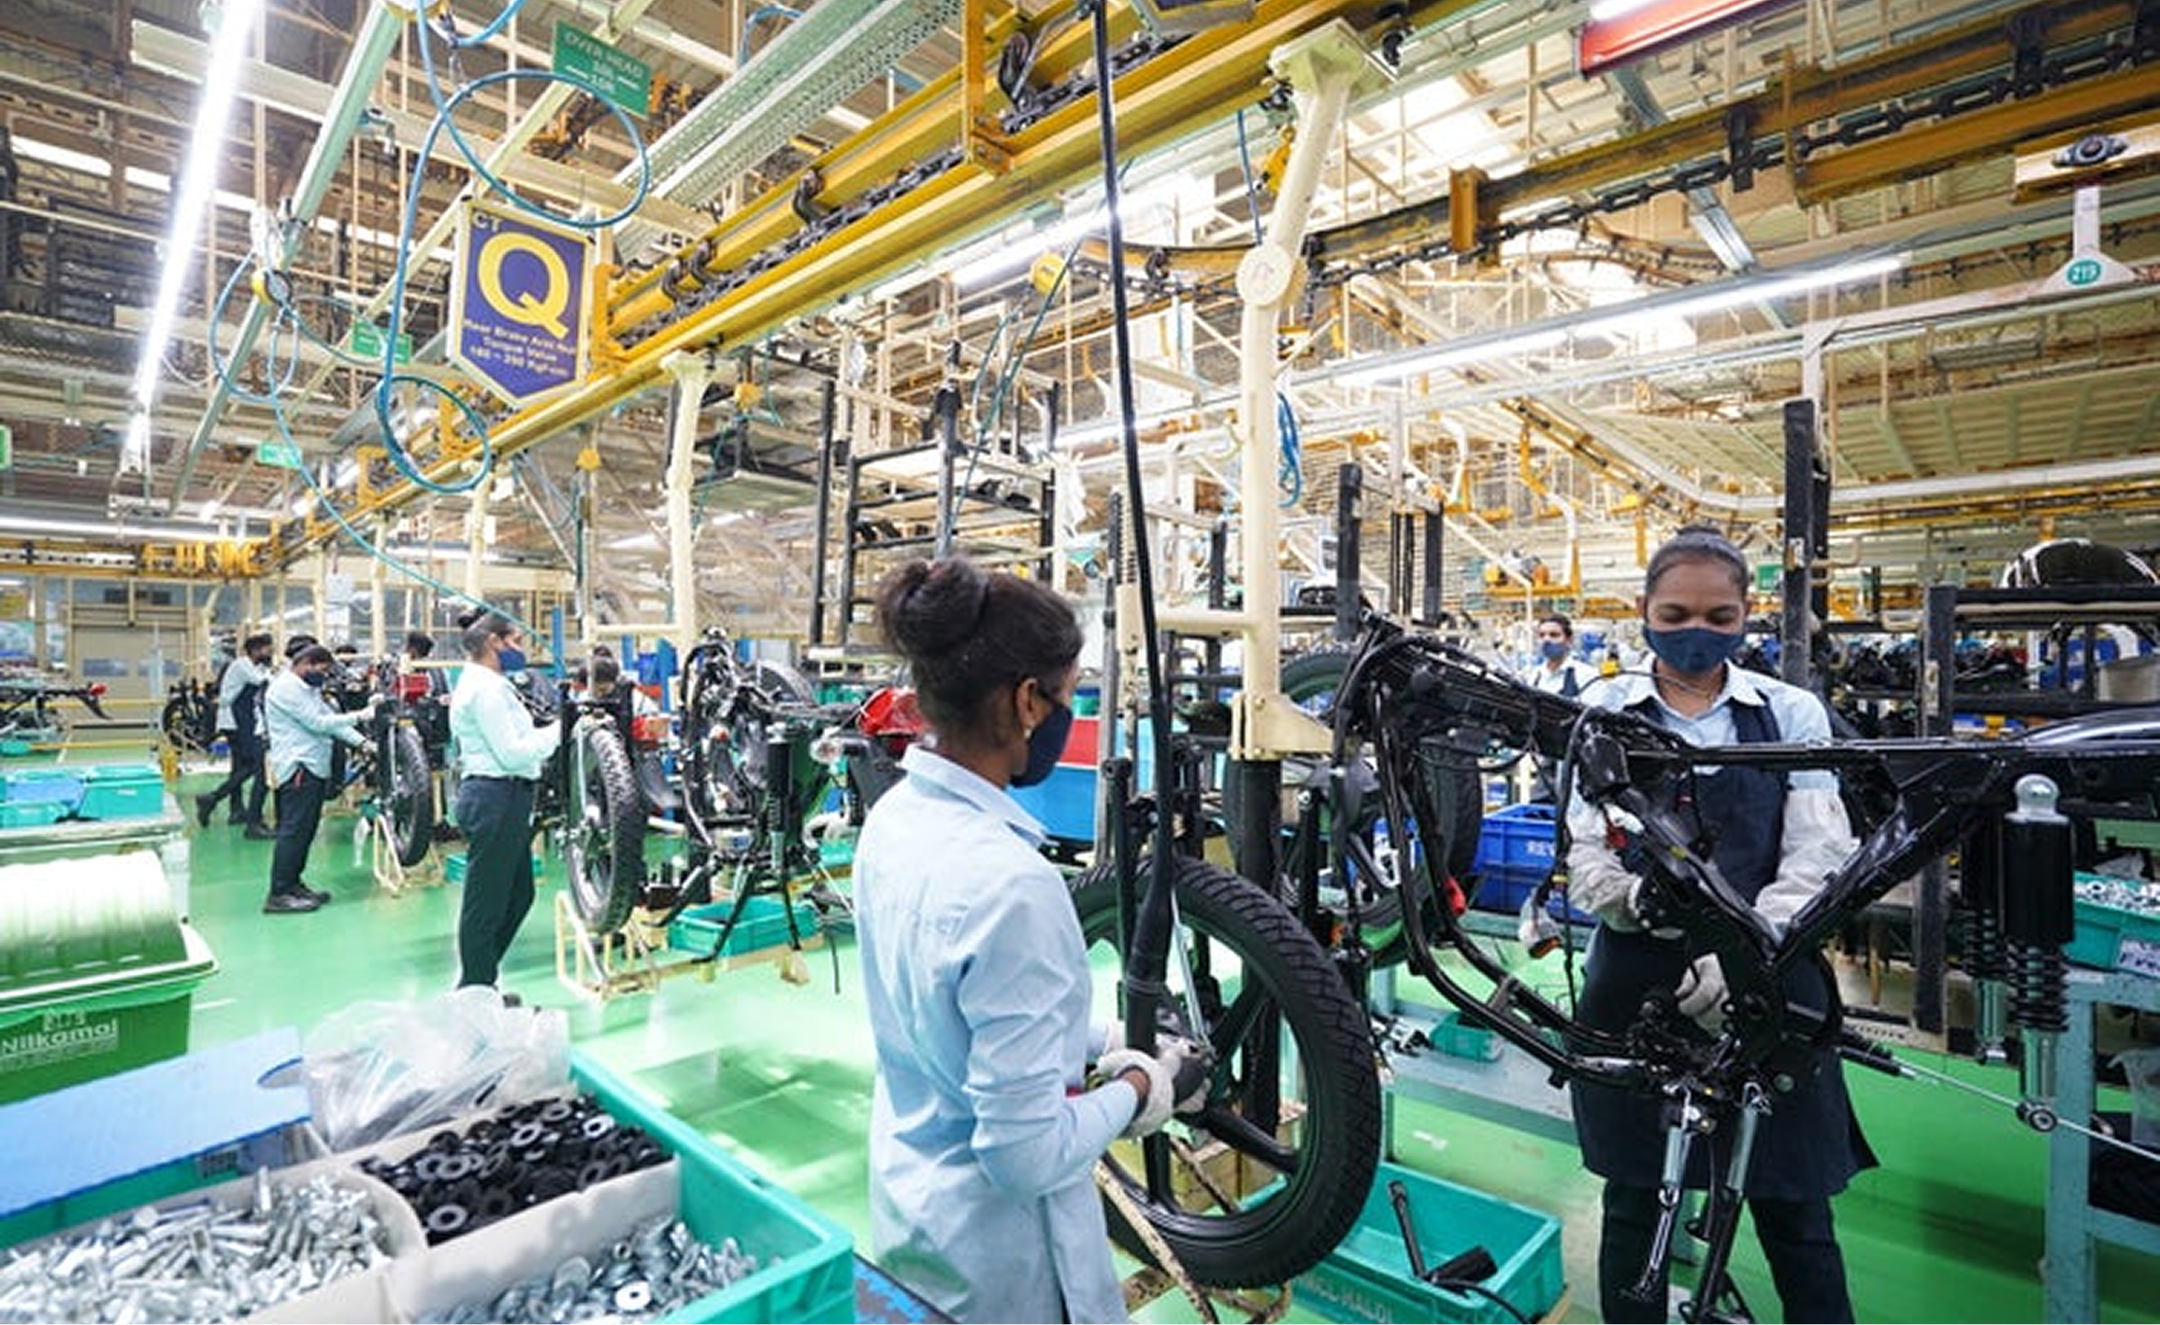
Driving manufacturing with Service Design methodologies for intelligent diagnostics and optimized maintenance.
Client : Hero MotoCorp
Industry : Manufacturing (Automobile)
My Role : End-to-end service design and strategy.
Duration : Jul 2022 - Feb 2023)
Team : +3 Designers
Introduction
Hero MotoCorp Ltd. is an Indian multinational two-wheeler manufacturer HQ’d in Delhi, India. They aimed to enhance their plant operational functionality and optimise day-to-day workflows.
The goal was to reduce errors from manual data capture, provide real-time data-driven insights, and enable seamless connectivity between manufacturing units, shop floors, and operators.
Objective
Drive end-to-end digital transformation across plant operations to boost efficiency, enhance quality, optimize maintenance through predictive solutions, and minimize downtime, creating a more agile, reliable, and high-performing manufacturing environment.
Impact
Scope
Conduct end-to-end research of plant operations, identify pain points and opportunities, co-create and iterate strategic digital solutions with stakeholders, and deliver research insights and design concepts to enhance the Digital Factory journey experience.
Why intervention was needed?
Existing pilot system had been running for ~2 years in one of the plants, but it lacked usability, integration depth, and alignment with end-users’ needs.
The existing manual processes caused errors and inefficiencies leading to inaccurate data interpretation. The pilot system did not fully support real-time insights, cross-functional connectivity, or predictive maintenance capabilities.
A seamless, data-driven ecosystem was required to connect manufacturing units with shop floors and enable end-to-end operational excellence.
Challenges
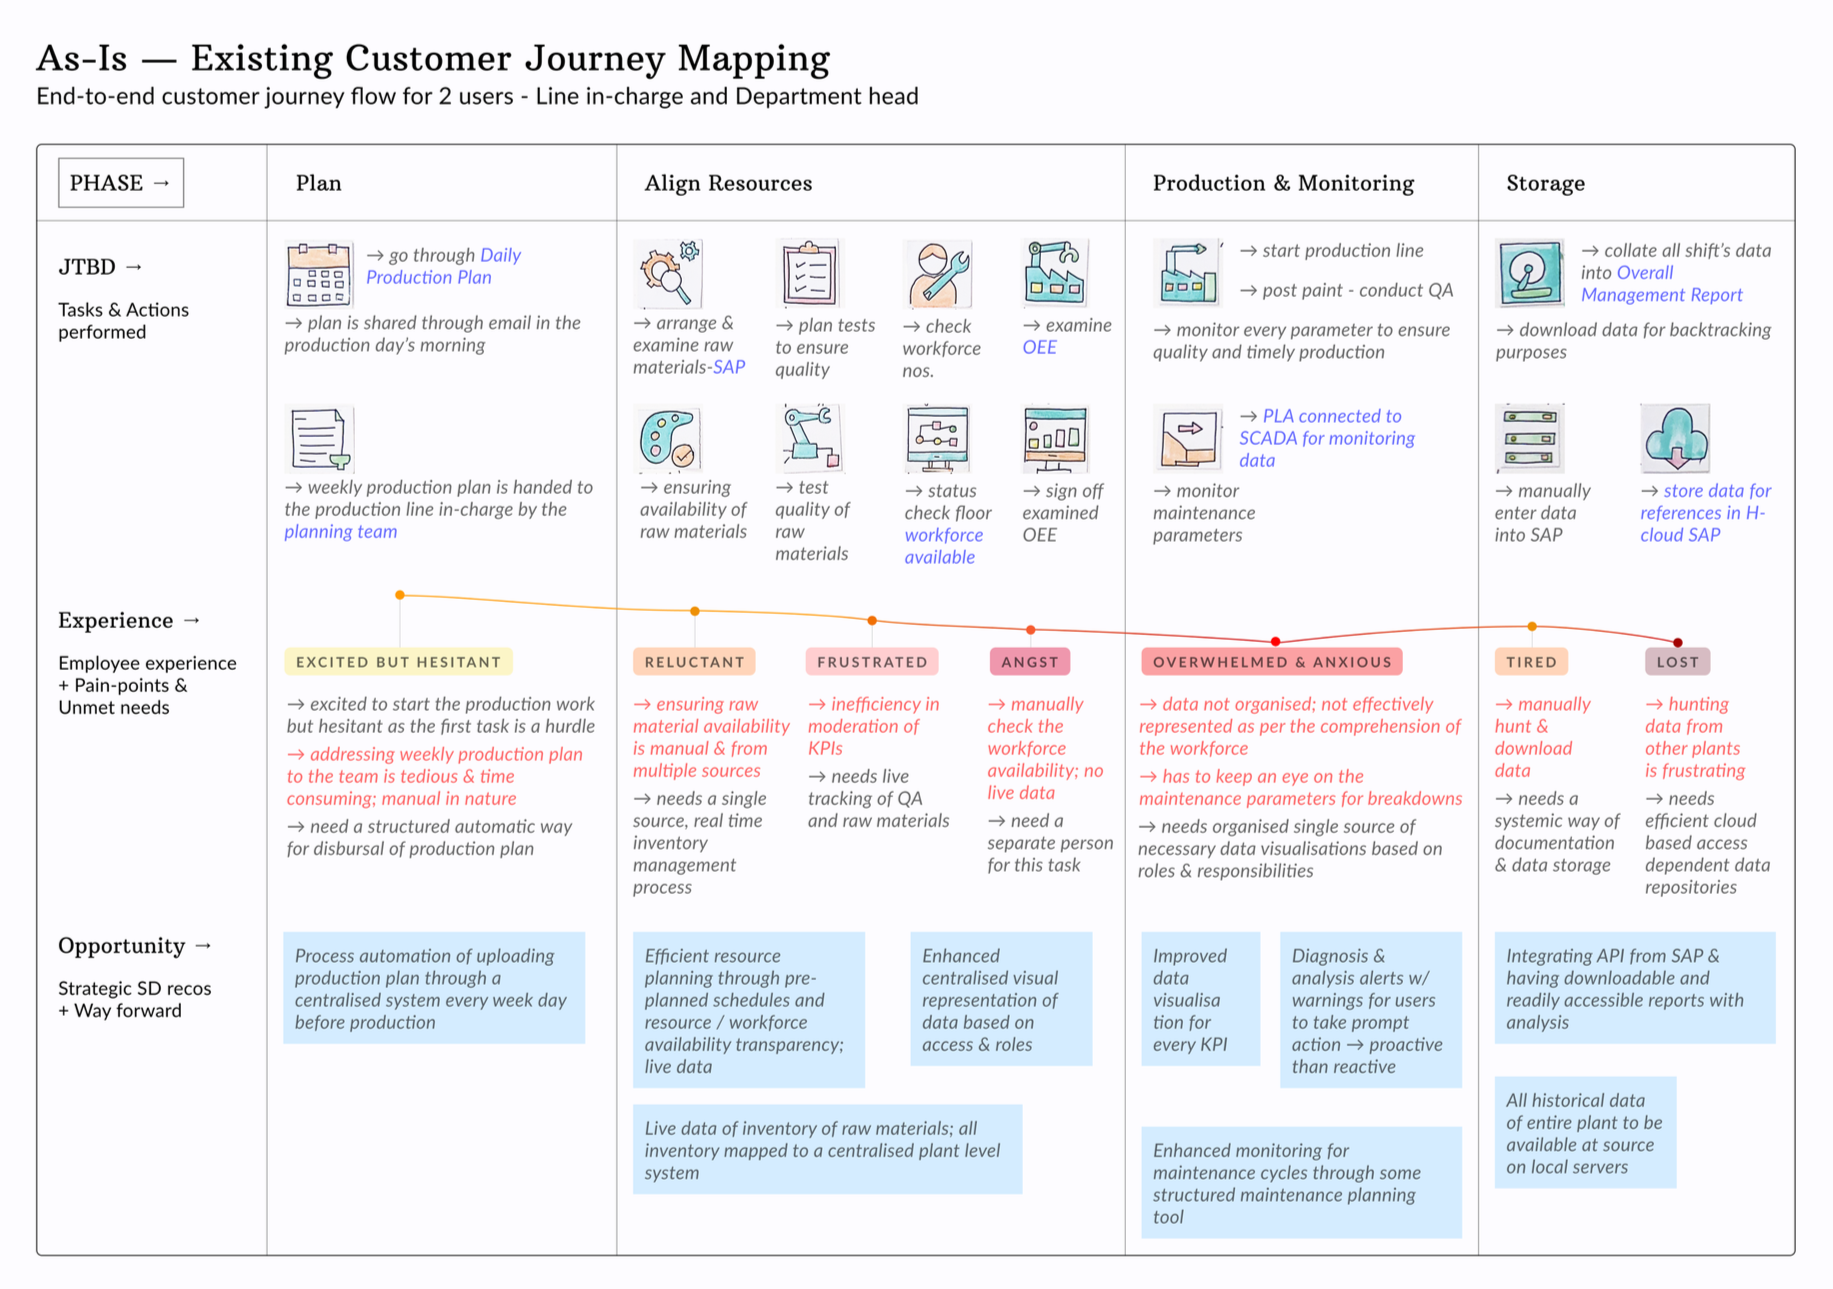
We conducted user interviews and workshops at one of the manufacturing plants, analyzed the findings, and distilled them into insights and to-be journeys, identifying key challenges and process bottleneck.
01
Risk of Human Error & Operational Inefficiency
Heavy reliance on manual KPI tracking, safety checks, and Excel-based data entry leads to user fatigue, inefficiencies, and increased risk of errors.
02
Lack of Automation & Real-Time Visibility
Absence of automated data capture, centralized KPI tracking, and synchronized systems limits production optimization & adherence to daily plans.
03
Delayed Breakdown Response & Productivity Loss
Insufficient real-time alerts and actionable insights on breakdowns lead production losses, disrupted workflows, and reduced plant productivity.
How might we, transform fragmented workflows into a connected, data-driven ecosystem that ensures consistent quality, reduces downtime, and maximizes overall plant performance?
Our approach for the solution
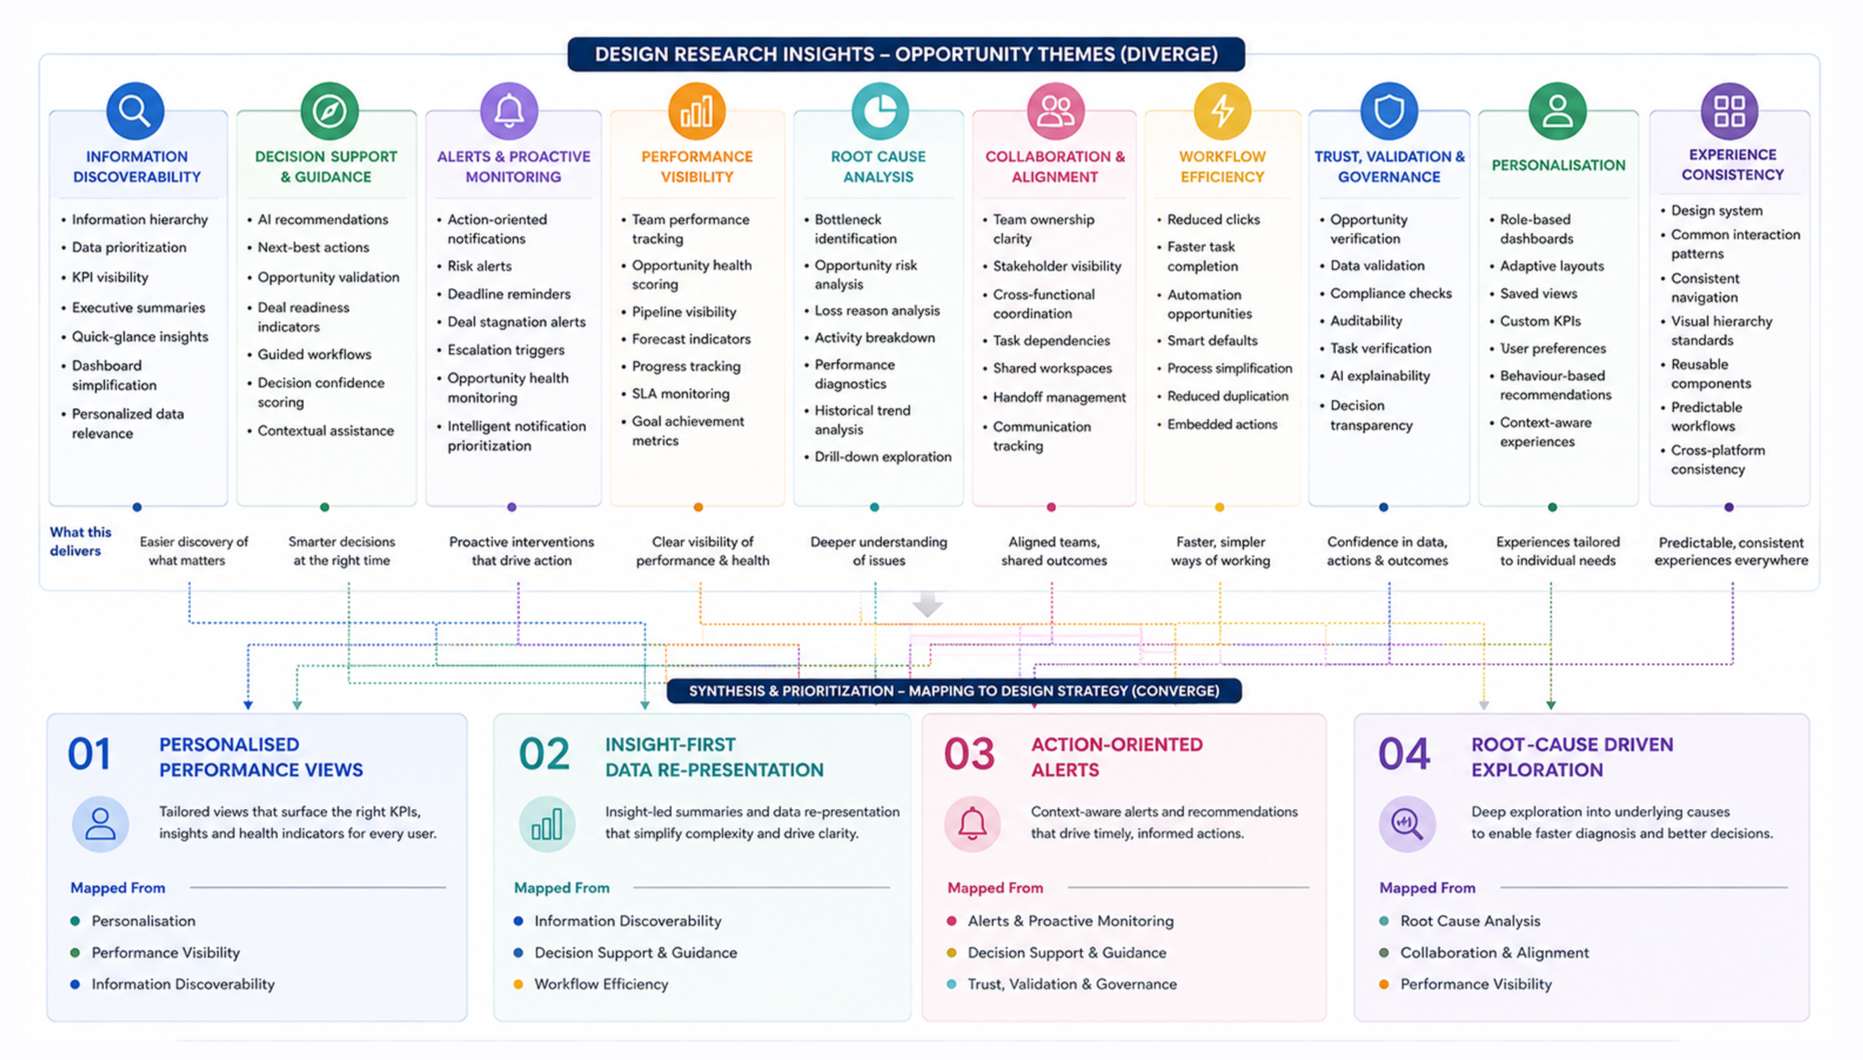
We identified key solution directions to be taken post our research, focusing on critical tasks and KPIs for two user types: Plant Head and Line In-Charge. Thus mapping all the possible directions for the solutions as shown below.
Our Design Strategy
01
Personalised Performance Views
Empower users to customize dashboards by selecting role-relevant KPIs, ensuring relevance, clarity, and sustained engagement.
02
Insight-First Data Re-presentation
Present a consolidated, high-level summary of critical parameters upfront, allowing users to quickly assess plant health and prioritize actions.
03
Action Oriented Alerts
Deliver unified, context-aware notifications on critical parameters to enable faster response, reduced downtime, and improved operational reliability.
04
Root-cause Driven Exploration
Enable deep dives from alerts and summaries into underlying data, supporting quick diagnosis and solution-oriented decision-making.
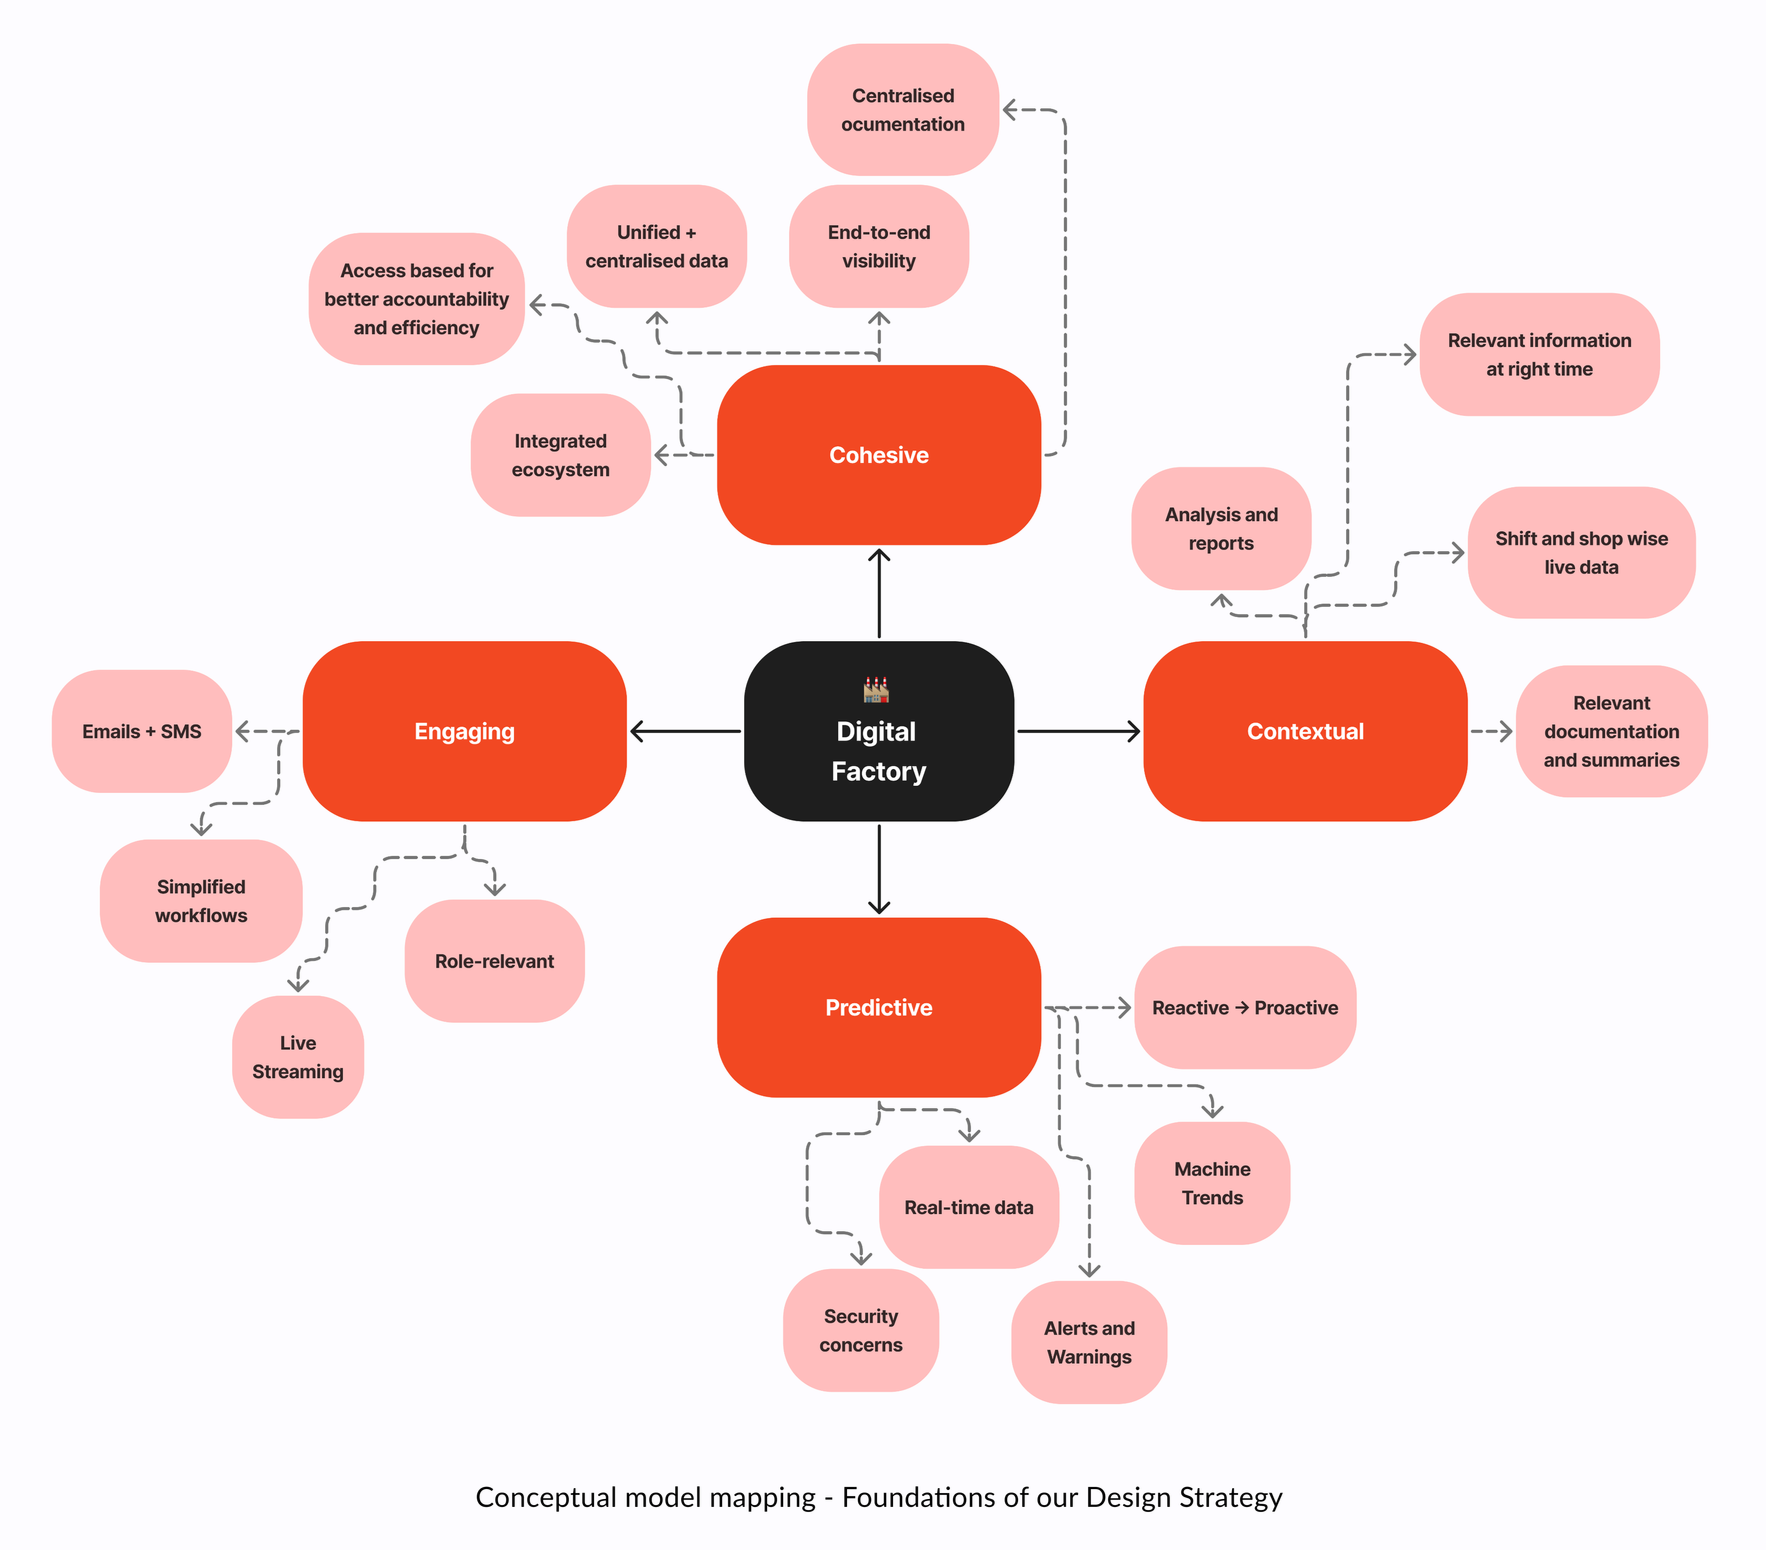
To shape and validate solutions, we developed a concept model grounded in four core pillars:-
Predictive - Move from reactive to proactive operations by leveraging real-time data, trends, and intelligent alerts to anticipate issues, reduce downtime, and support informed decision-making.
Engaging - Create intuitive, role-relevant experiences that encourage active usage, simplify complex workflows, and reduce cognitive load across user groups.
Contextual - Deliver the relevant information at the right time; tailored to user roles and plant conditions, and operational priorities that enable faster and more accurate actions.
Cohesive - Establish a seamlessly integrated ecosystem that unifies data, systems, and stakeholders across shops, enabling end-to-end visibility and collaborative efficiency.
Building the Concept Model
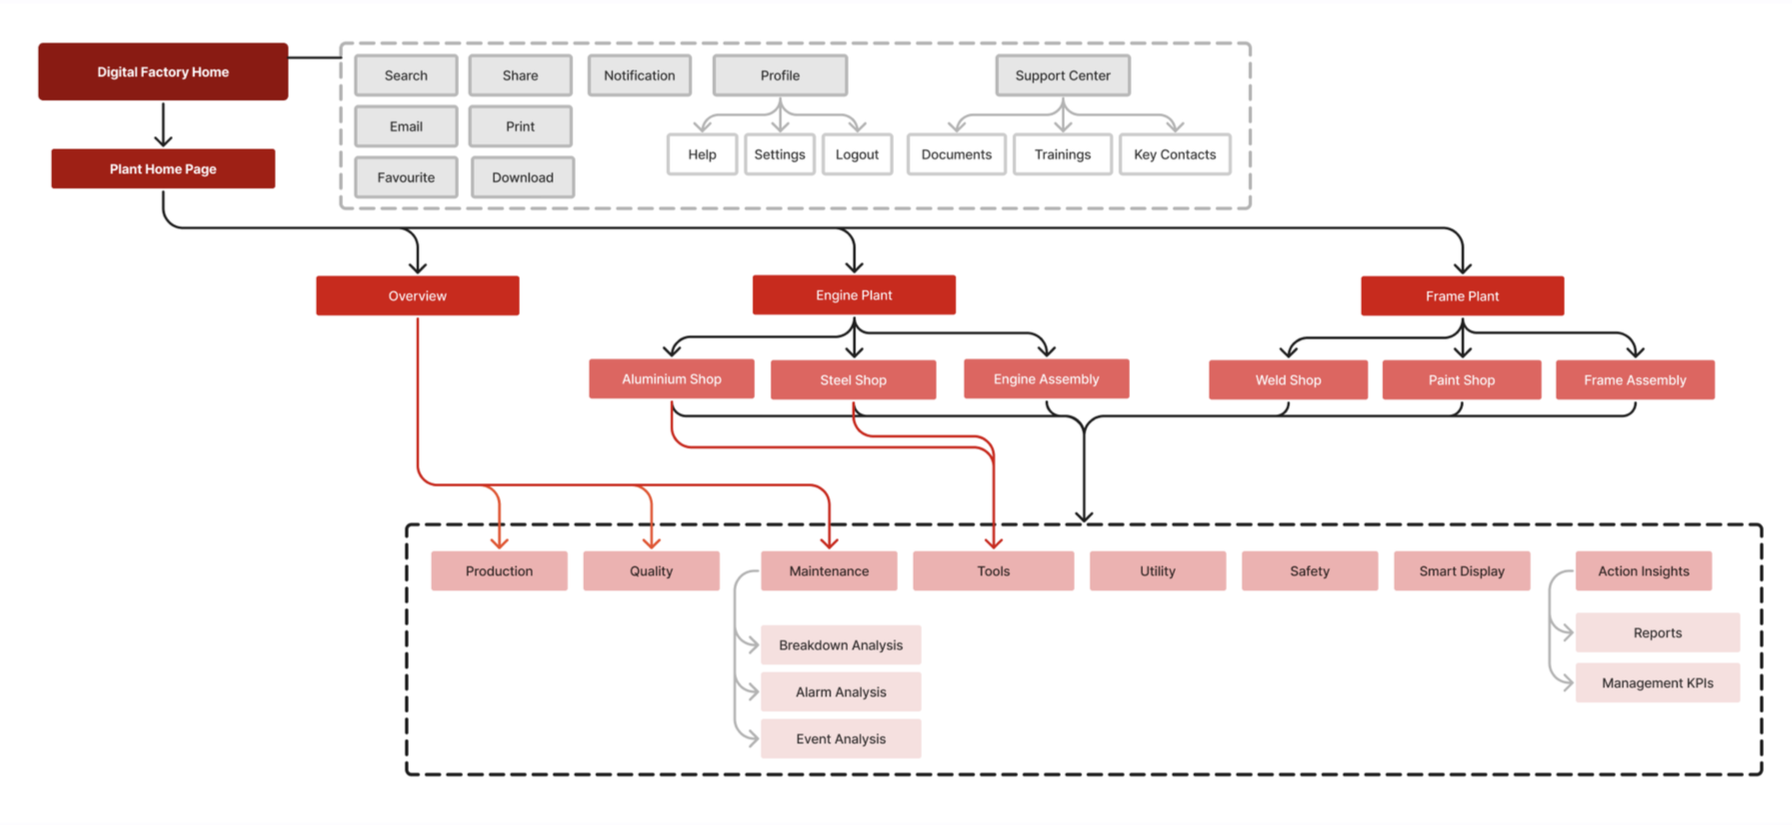
Fluid IA - effortless movement across the platform
Our final converging
As a final converging point to build the holistic design solution, we laid out the below possible solution statements and based on frequency and impact, enveloped them into 4 themes as design solutions.
01
Establish a centralized, integrated platform that serves as the single source of truth, enabling seamless collaboration, consistent data access, and end-to-end operational visibility.
02
Surface the most relevant information, insights, and actions based on user role, operational context, location, and real-time conditions to reduce cognitive load and improve decision-making.
03
Provide live monitoring of assets, equipment, and operational performance through intuitive dashboards, streaming data, and continuously updated status indicators.
04
Transform critical events, anomalies, and operational deviations into actionable alerts that enable faster response and intervention.
05
Leverage machine trends, historical patterns, and operational intelligence to anticipate failures, forecast risks, and proactively recommend maintenance actions.
06
Translate complex operational data into prioritized recommendations, next-best actions, and decision-support mechanisms that accelerate resolution and execution.
07
Deliver configurable dashboards, role-based access, and tailored workflows that adapt to individual user responsibilities and preferences.
08
Reduce friction through guided journeys, streamlined processes, and intuitive task orchestration that help users complete critical activities efficiently.
09
Ensure reliability, consistency, security, and traceability of information through robust governance mechanisms and transparent data practices.
10
Make documentation, reports, procedures, and historical records readily accessible within the user's workflow, eliminating the need to switch between systems.
11
Continuously transform operational data into meaningful analytics, reports, and performance insights that support both day-to-day operations and strategic planning.
12
Enable users to move seamlessly from high-level summaries to detailed diagnostics, uncovering contributing factors, anomalies, and underlying causes with minimal effort.
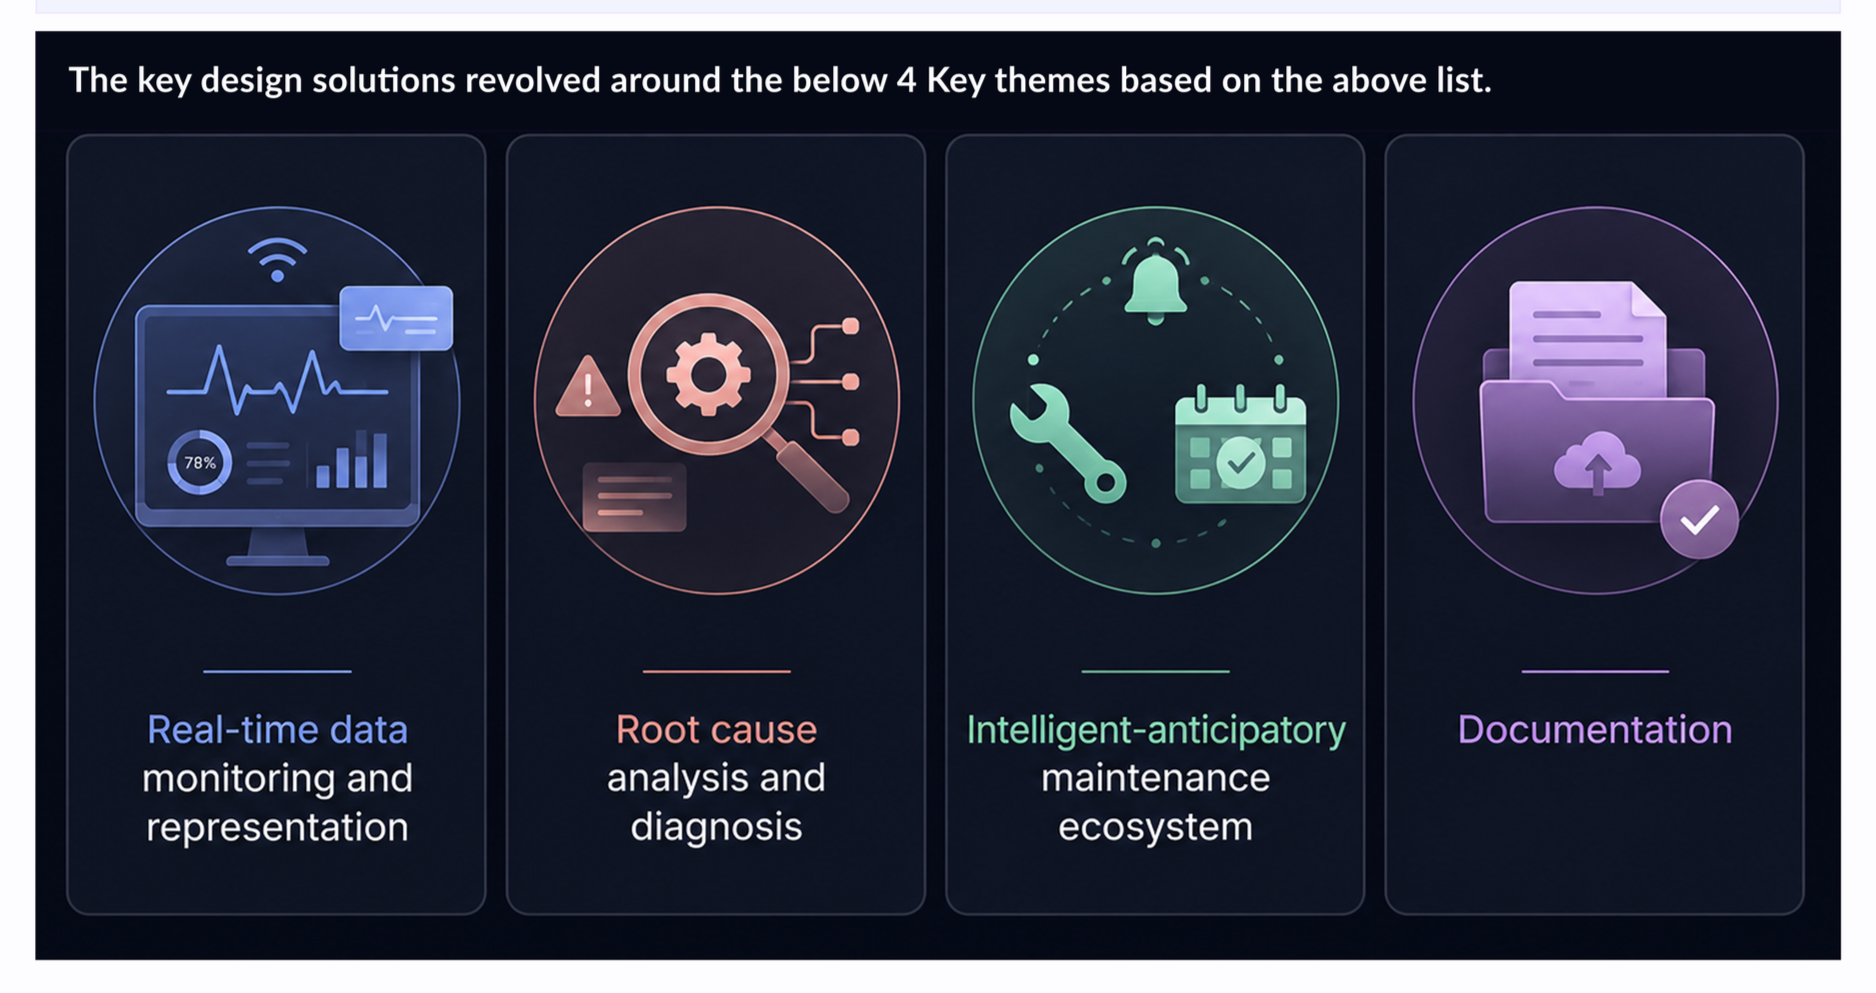
The solution built an integrated ‘Plant Health Intelligence Layer’ atop the existing portal, focusing on 3 key directions to reduce manual work, enable real-time monitoring, and shift from reactive to anticipatory maintenance.
Design Outcomes
01
Real-time data monitoring and representation
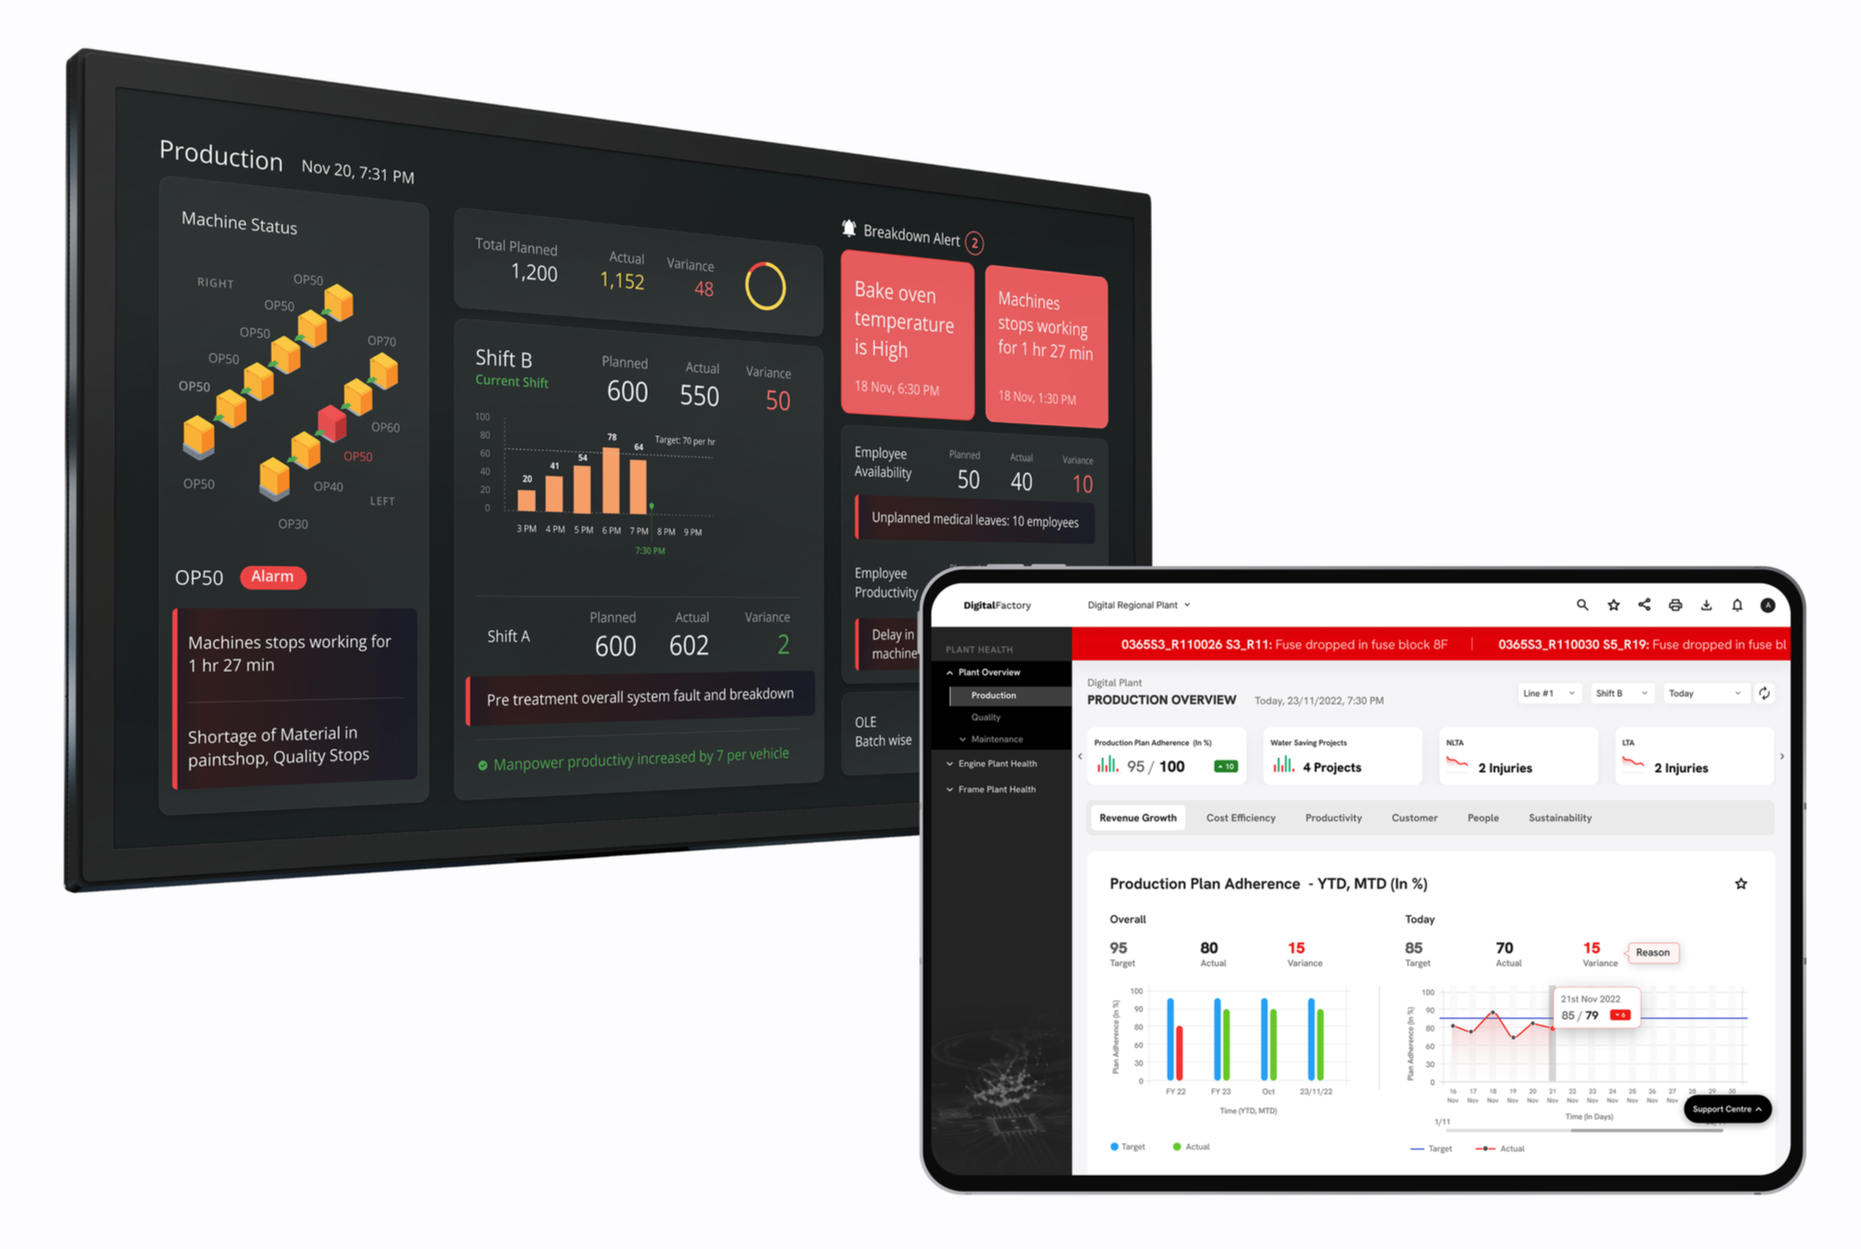
Proposed Resolution
Scale the existing sensor infrastructure to capture real-time equipment data - such as temperature, vibration, runtime, and load, and translate it into intuitive, user-centric KPI enabled dashboards.
These role-based, shop-specific dashboards will provide tailored access and prioritize critical alerts and warnings, enabling users to make timely, informed decisions.
02
Root cause analysis and diagnosis
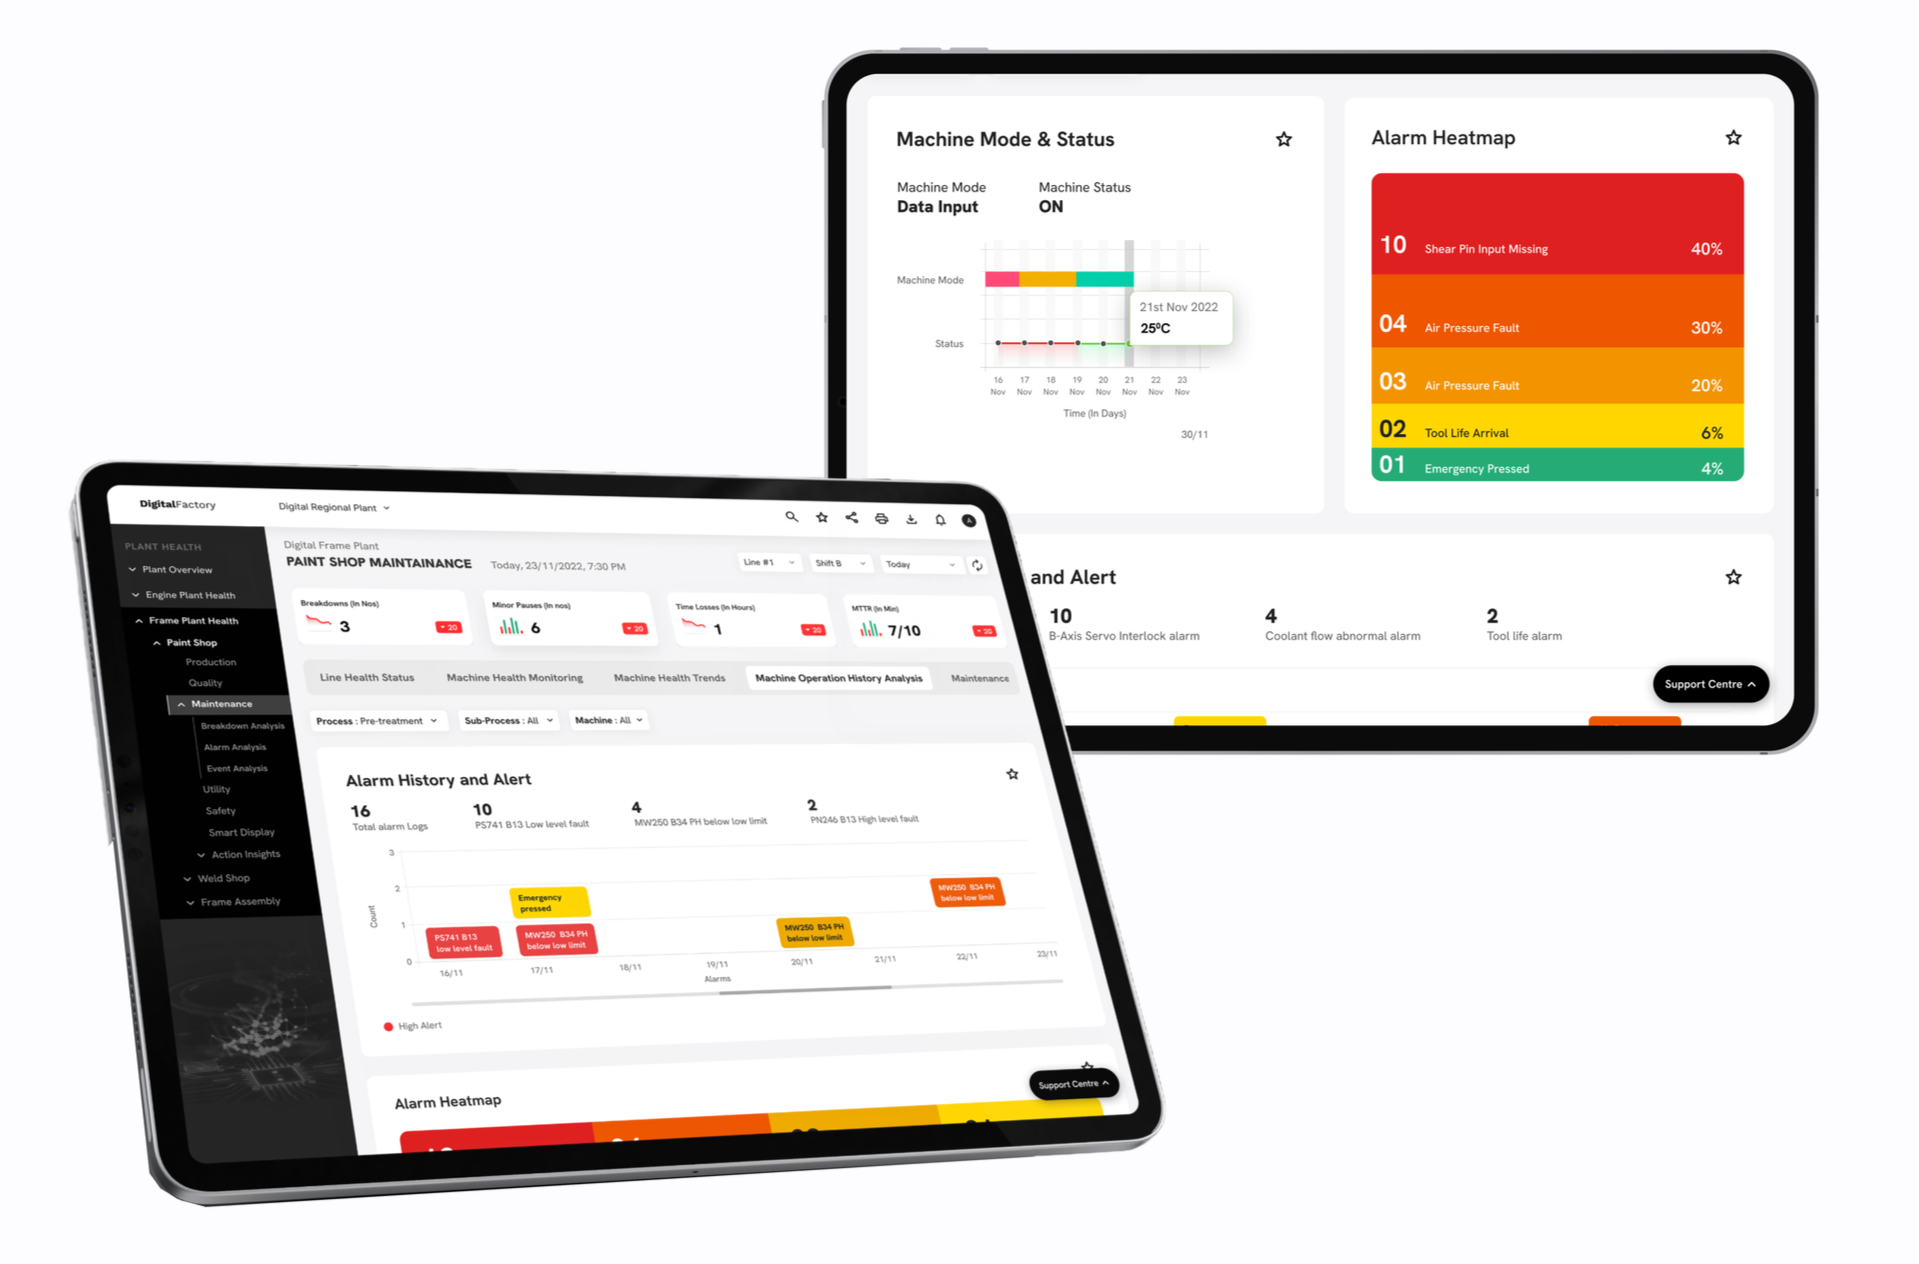
Proposed Resolution
→ Establish a centralized machine health diagnostics system that delivers action-oriented insights through intelligent data visualization. Each KPI will be mapped against defined optimal thresholds, and any deviation will automatically trigger real-time alerts, complete with diagnostic insights and recommended next actions - routed directly to the responsible stakeholder.
→ This approach replaces fragmented communication channels such as calls and emails with an integrated, real-time breakdown command system that enables rapid response, clear accountability, and reduced downtime while empowering users to directly investigate, diagnose, and resolve root causes within the platform.
03
Intelligent-anticipatory maintenance ecosystem
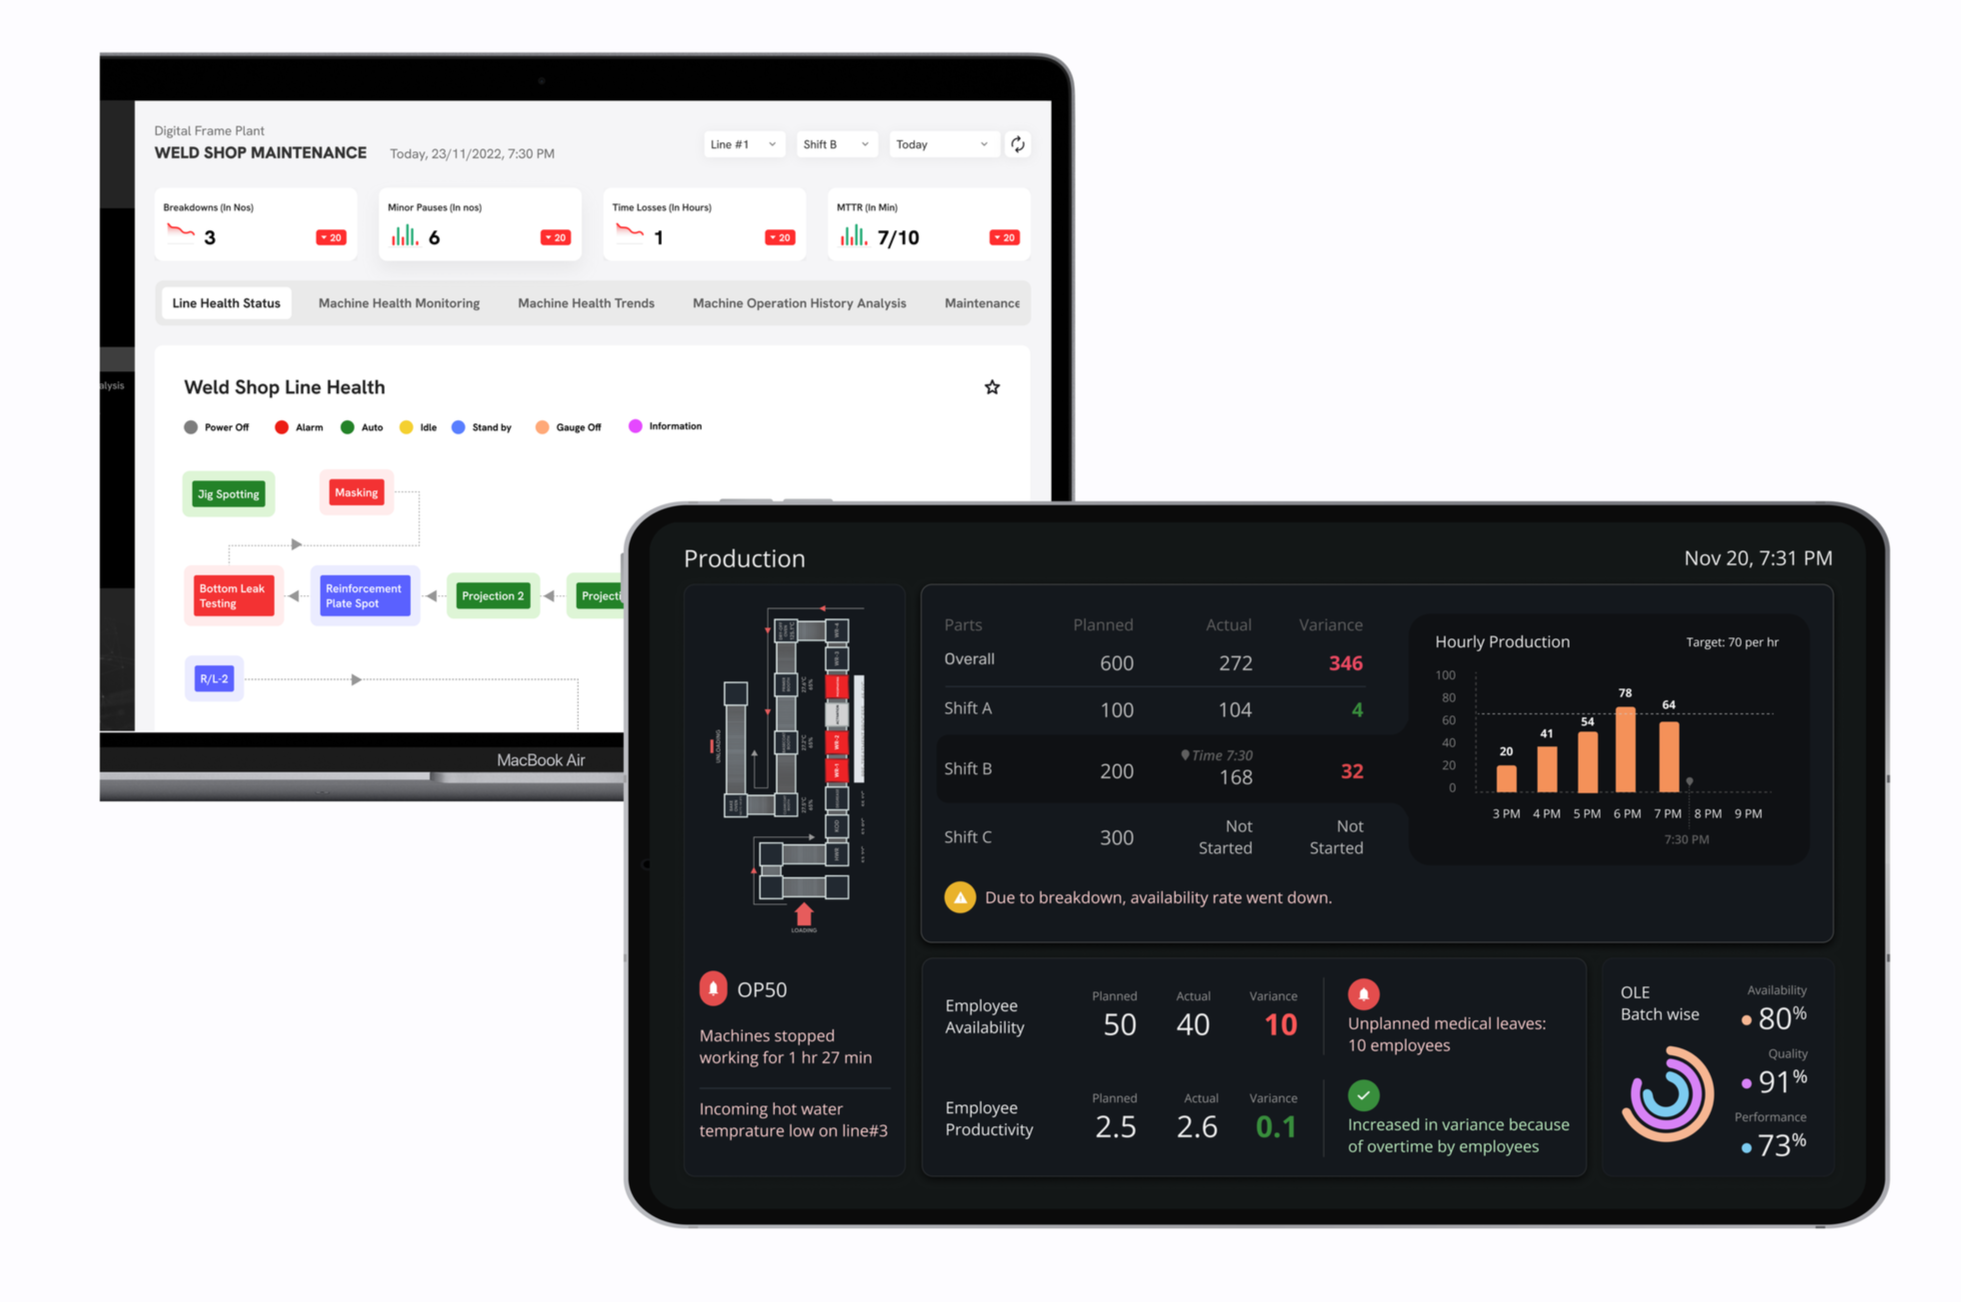
Proposed Resolution
→ Leveraging data captured from IIoT sensors and dashboards, the maintenance ecosystem evolves into a powerful enabler of Predictive (PdM) and Preventive (PrM) maintenance by guiding timely preventive actions and accelerating breakdown response.
→ Introducing a Smart Maintenance Scheduler - a dynamic, condition-based protocol that replaces rigid schedules. Powered by real-time machinery data, it automatically adjusts maintenance intervals based on actual equipment health and performance.
→ Hence, PrM becomes more intelligent by detecting early signs that something may be wrong, while PdM acts as the trigger that provides action-oriented diagnosis and suggests what should be done next. Each trigger is mapped to a dynamic risk score, clearly indicating the severity and criticality of the issue to support prioritized decision-making.
04
Documentation (Not a separate direction, but a foundational layer across all 3)
Proposed Resolution
→ Furthermore, all three interventions can be strengthened by documenting and storing analyses and reports in a structured, access-controlled cloud repository, ensuring organized, quickly retrievable data for faster decisions.
→ Integrating these documents with GenAI enables automated summaries, standardized reports, and consistent documentation, boosting efficiency and knowledge sharing across factories.
Impact of our outcomes
As the engagement lasted for just 4 months - post the delivery of our solutions (for visual enhancements of the designs)
we were only able to track the impact based on the very short period till the end of the engagement.
All the figures are therefore approximates.
Business Outcome
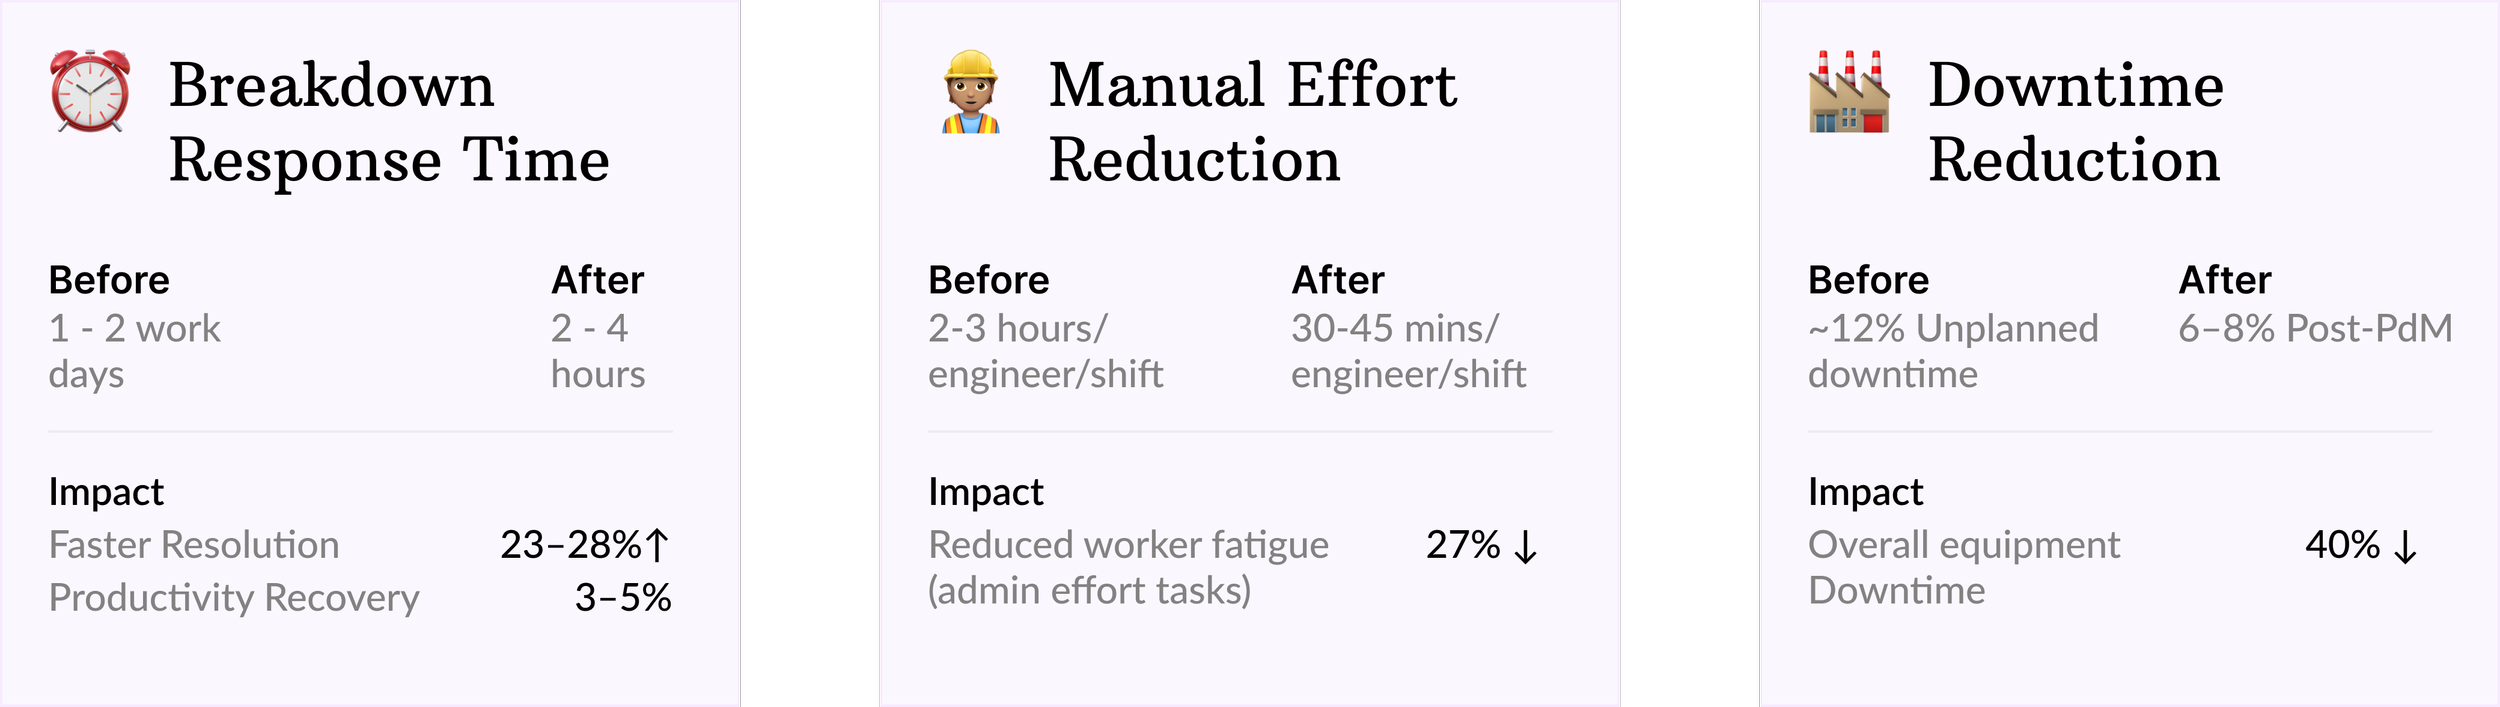
→ Reduced unplanned machine downtime by an estimated 40% and accelerated breakdown response time from 1–2 days to under 6 hours.
Operational Improvement
→ Re-architected plant monitoring workflows reduced manual data capture, cut engineer reporting time by 27% (from approx. 2–3 hours to 30–45 minutes per shift), and enabled predictive maintenance insights across shop-floors.
Employee Efficiency
→ Cross-functional collaboration improved across shop-floor operators, plant engineers, IT teams, and leadership stakeholders to align data visibility and decision-making by ~13%.
More of my Work…
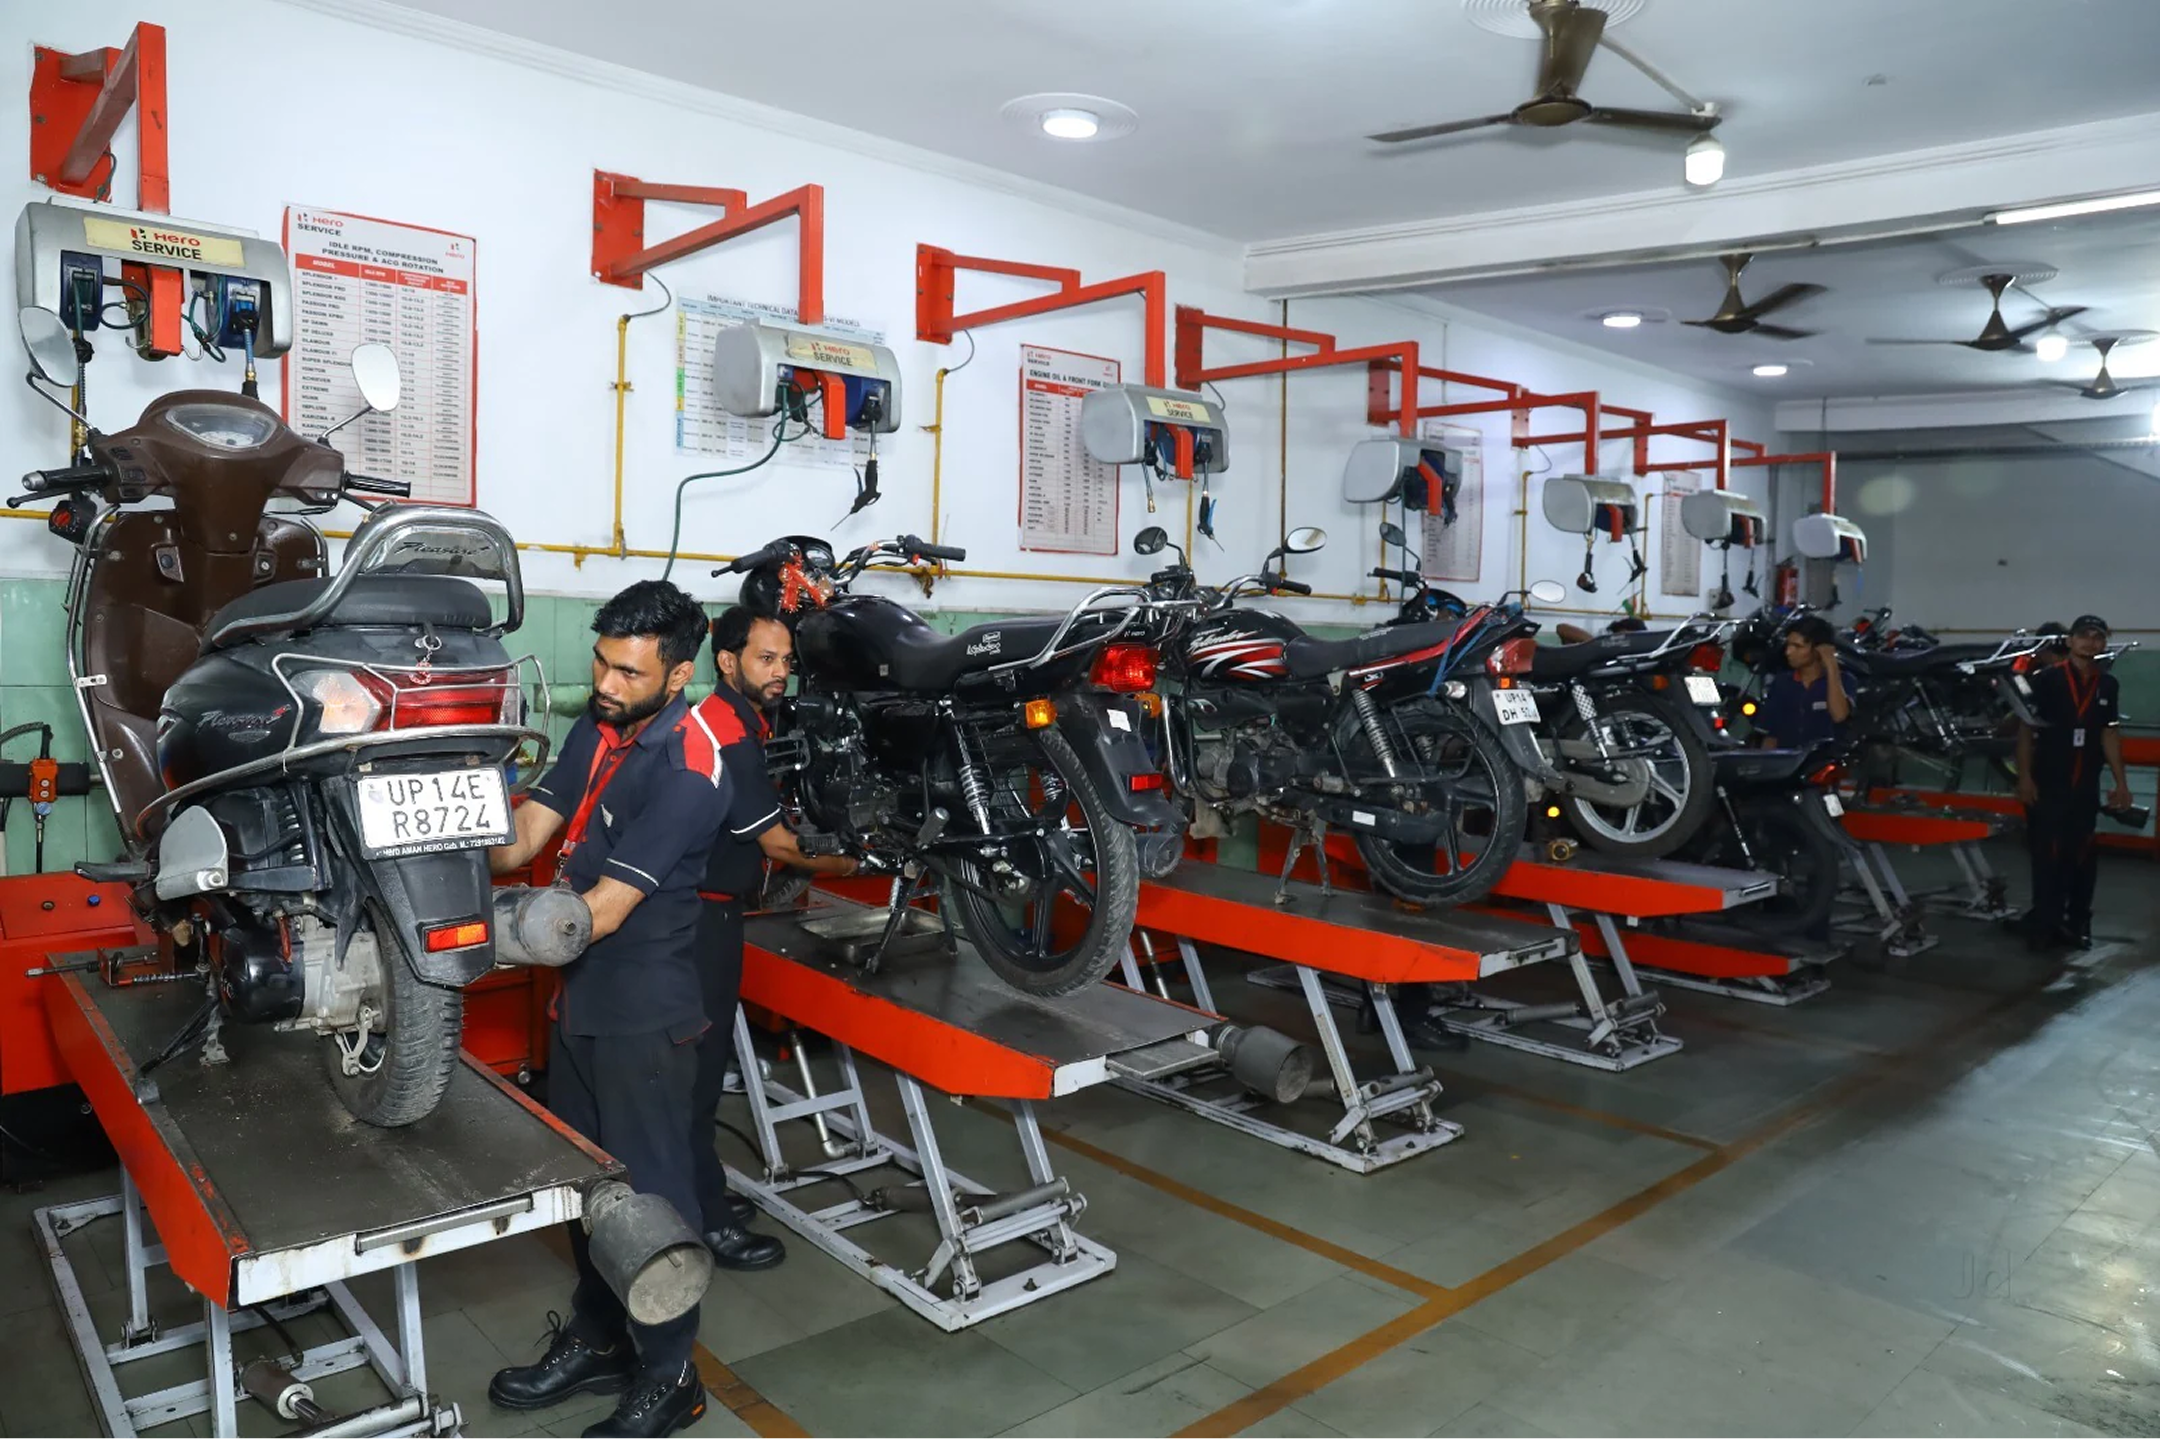
Vehicle Service Floor Management
Optimizing Automobile Service station operations to Boost Efficiency, Accuracy, and Customer Engagement
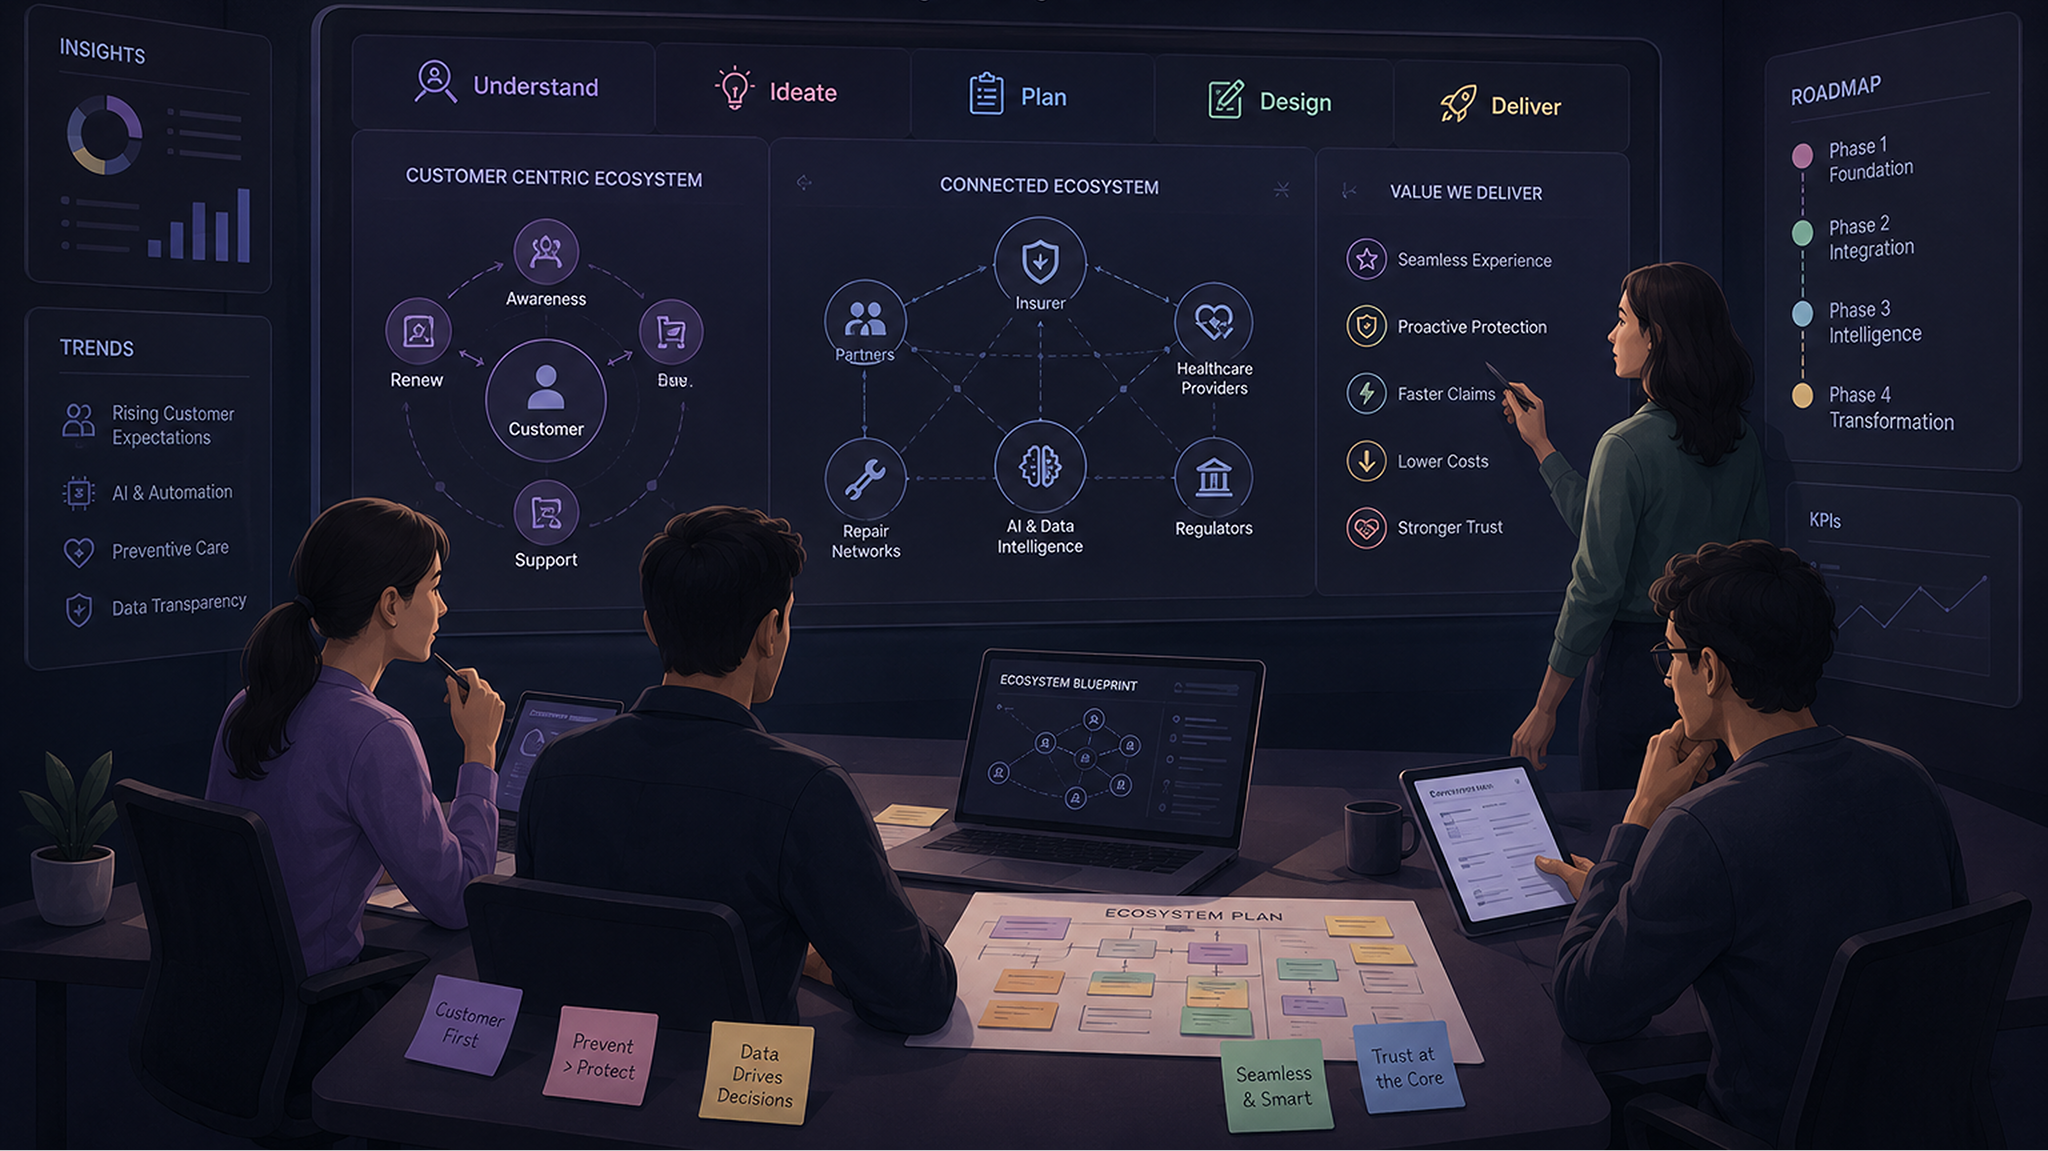
D2C Insurance Ecosystem transformation
A proposal for enabling innovative transformation of an insurance provider for omni-channel futuristic journey experiences.